
Concrete Data
Data is everywhere – it comes and goes in seconds.
With the Concrete Data project it is chiseled in stone – forever.

My inspiration came from the tachographs every German truck driver has to use. They are used to plot out the speed over time to track that they don’t exceed their driving time and speed limitations.

The idea was transferred to build a radial plotter which prints out the productivity in the office over time.


Compared different mechanics and drives to lift the pen.


The physical representation makes it more interesting to interact with it according to your workflow.
After the „pen and paper version“ of the productivity plotter I build a more abstract version made of concrete. A small chisel carves the concrete and plots out the given data.
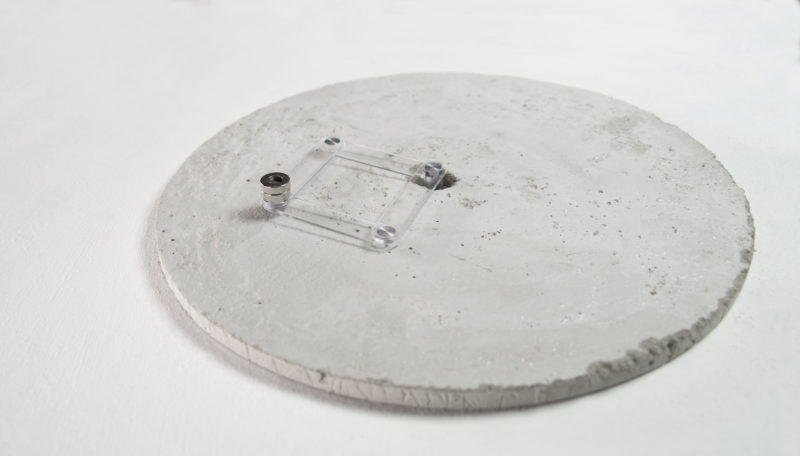
Done with the plotter I took the project one step further and created a concrete version. It pointed better on the way how you spend your time. Once a moment is over, there is no way back.
It was created as a course project during the opening of interface design at Fabian Hemmerts InterfaceLab